Futures Wrap: Powell's Last Day, Oil Hits $107, S&P 500 Closes Above 7,500 for First Time
Oil surges 9% on week as Strait of Hormuz stays closed. Fed Chair Powell exits, Kevin Warsh takes over. Equities post seventh straight weekly gain. Metals crash on rate hike fears.
Jerome Powell's 14-year run at the Federal Reserve ended today. Kevin Warsh takes the chair. Oil topped $107 intraday. The S&P 500 closed above 7,500 for the first time in history. And metals got crushed as Treasury yields hit one-year highs.
That's the scorecard for Friday, May 15, 2026. Below, we break down what moved, why it matters, and what traders should watch next week.
The Scoreboard
Here's where the key futures contracts closed on Friday:
- ES (E-mini S&P 500): 7,521.75, down 0.37% on the day, up for the week
- NQ (E-mini Nasdaq 100): 29,750.75, session high 29,773.75
- YM (E-mini Dow): 50,044, down 110 points (0.22%)
- CL (WTI Crude Oil): $104.12, up 3%+ on day, up 9%+ for the week
- GC (Gold): $4,617.87, down 2.7% from Thursday
- SI (Silver): $77.68, down 8%+ on the session
- 10-Year Treasury Yield: 4.55%, highest in one year
Equities are posting their seventh consecutive weekly gain. Oil is the standout, surging nearly double digits on the week as Strait of Hormuz disruptions continue. Metals took the hit as rising yields made bonds more attractive than non-yielding assets.
What Happened
The Powell Exit and Warsh Era Begins
Kevin Warsh officially takes the helm at the Federal Reserve after a historic 51-50 Senate confirmation vote. Vice President Vance cast the tie-breaking vote to confirm Warsh, a former Fed governor who served under Bernanke from 2006 to 2011.
Markets are watching closely because Warsh's policy stance remains somewhat ambiguous. He has criticized excessive Fed intervention in the past, but he also supported aggressive action during the 2008 crisis. The question now: how will he handle inflation running hot while geopolitical shocks keep oil prices elevated?
The CME FedWatch Tool shows 45% odds of a rate hike sometime this year. That's up from 1% just a month ago. The shift happened fast as oil prices and inflation data moved together in the wrong direction.
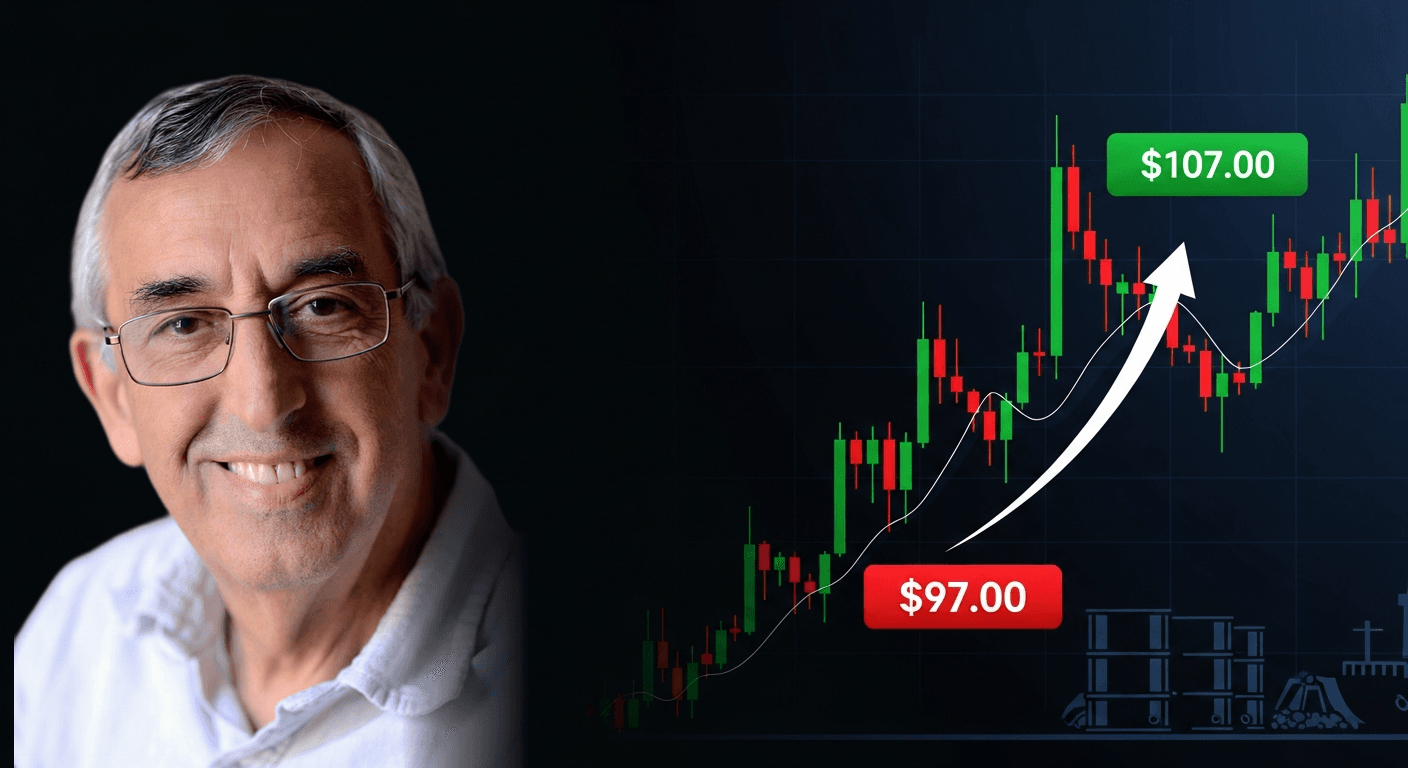
Oil's Relentless Climb
WTI crude touched $107 intraday before settling around $104. That's a weekly gain of over 9%, and crude is now at levels not seen since the immediate aftermath of Russia's invasion of Ukraine in 2022.
The driver: the Strait of Hormuz remains effectively closed. The International Energy Agency reported that crude and fuel flows through the strait fell by approximately 4 million barrels per day in March and April. That's roughly 20% of global seaborne oil trade.
President Trump sent mixed signals from the US-China summit in Beijing. He first said the US did not need the Strait open, then reversed course, stating alongside President Xi that "we want the straits open." Diplomatic attempts to resolve the US-Iran standoff remain stalled.
The IEA warned the global oil market could remain "materially undersupplied" through October even if the conflict is resolved next month. For futures traders, that means CL remains a high-volatility contract with real trending potential.
Equities Keep Grinding Higher
The S&P 500 closed at a record 7,501.24 on Thursday, breaching the 7,500 level for the first time. Friday saw a modest pullback with ES settling around 7,521, down 0.37% on the session but still green for the week.
The Dow recaptured 50,000 on Thursday after a 370-point jump, its first close above that milestone since mid-March. Cisco Systems powered gains after raising its full-year revenue and earnings forecast, jumping 13% on the session.
Tech continues to lead despite rising yields, an unusual dynamic. Normally, higher rates pressure growth stocks because they make future earnings less valuable in present-day terms. The AI narrative seems to be overriding that math for now.
Metals Crash as Yields Spike
Gold fell 2.7% to $4,617.87. Silver got demolished, dropping over 8% to $77.68. Copper shed 4.2%. It was a broad metals selloff.
The culprit: the 10-year Treasury yield spiked 9 basis points to 4.55%, its highest level in a year. When bonds start yielding real returns again, the opportunity cost of holding non-yielding gold increases. Money flows out of metals and into fixed income.
Silver's 8% drop is notable because the metal set an all-time nominal high of $121.67 in January. It's now trading nearly 40% below that peak. For trend traders, this creates opportunity on both sides, particularly if you can identify when momentum shifts.
What Traders Are Watching Next Week
Several catalysts loom:
- Warsh's first public comments as Fed Chair. Markets will parse every word for clues on whether he leans hawkish or dovish given current conditions.
- Iran diplomatic developments. Any progress reopening the Strait of Hormuz could send oil sharply lower. Continued stalemate keeps the supply squeeze in place.
- Housing data releases. Existing home sales and housing starts hit next week, providing another read on how consumers are handling elevated rates.
- Retail earnings season continues with major names reporting. Consumer spending data remains critical for gauging recession risk.
For oil traders, the price action around $100 to $110 creates a clear trading range. Breakout above $110 targets the 2022 highs. A resolution in Iran negotiations could send prices back toward $80 fast.
Equity traders should watch whether rising yields finally crack the AI-driven rally. The S&P 500 has absorbed a lot of bad news this year. That resilience may continue, or the seventh weekly gain could mark a near-term top.
ETF Corner
High-volatility weeks like this one are where disciplined risk management separates consistent traders from gamblers. Oil swinging $10 in a week, silver dropping 8% in a day, and Treasury yields spiking to one-year highs all create opportunity. They also create risk.
At Elite Trader Funding, you can trade these markets in a simulated environment where your risk is capped at your evaluation fee. Pass the evaluation, and you trade a funded account with real profit splits, up to $250K in simulated capital.
For traders who want to capitalize on oil volatility or test metals reversal strategies, the End of Day drawdown accounts provide flexibility for swing trades. If you prefer tighter risk control, Static drawdown evaluations offer fixed loss limits that reward consistent execution.
Check the testimonials page to see how other traders are building their accounts. Or jump straight to competitions if you want to test your skills against the community.
New to futures trading? Start with the day trading guide for beginners to understand the basics before taking on CL or SI.
Already know what you want? Start a 50K EOD evaluation and put this week's market thesis to work.
Final Word
Powell exits. Warsh enters. Oil stays bid. Metals get smoked. Equities somehow keep climbing. That's the tape.
Whatever your trading thesis, manage your risk, respect the volatility, and trade what you see. See you Monday.
External sources: CME Group Gold Futures, CME Group E-mini S&P 500